
How to Run Surveys: A Guide to Creating Your Own Research
Surveys are one of the most direct ways to learn something true about the people who matter to your business, your project, or your research. Not assumed, not inferred — actually measured.
A well-designed survey tells you whether your pricing model makes sense to customers, which feature your users actually want built next, how your team’s satisfaction has shifted over the last quarter, or whether the problem you’re planning to solve is the problem people actually have. That’s a different quality of information than gut instinct or anecdotal conversations.
The barrier to running this kind of research used to be real: expensive platform licenses, research methodology expertise, or a data team to handle the analysis. In 2026, that barrier is gone. Two platforms — SurveyNinja and Qualtrics — cover the full range from “I need to run a quick customer survey today” to “I’m conducting a structured academic study with 2,000 participants.” Both offer free starting points. Neither requires technical skills.
This guide walks through how to actually use them — from defining what you want to learn to reading results that lead somewhere useful.
Let’s walk through how to run your own surveys – from idea to insights – using free, reliable tools.
Why Surveys Still Matter
The reason surveys work is simple: they give people a structured way to tell you the truth without the social pressure of a conversation.
In a one-on-one interview, respondents adjust their answers based on who’s asking. In a focus group, the loudest person shapes the room. In a survey, each respondent answers independently — which makes patterns in the data meaningful rather than artifacts of the collection method.
For software companies specifically, surveys surface the gaps between what you built and what users actually experience. A post-onboarding survey that asks “what’s the one thing that confused you most?” generates actionable product priorities. A quarterly NPS survey that asks “how likely are you to recommend us?” tracks customer sentiment as a leading indicator before it shows up in churn data. Neither of those requires a research team. They require a clear question and a tool that routes the answer somewhere useful.
Getting Started: From Question to Structure
Before opening any platform, answer three questions in a sentence each:
What decision will this survey inform? (“We’re deciding whether to build X feature next quarter” is specific. “We want to understand our users better” is not.)
Who exactly will answer it? Existing customers, prospects, churned users, employees, and research participants are four different populations that produce four different data sets. Mixing them without segmentation produces noise.
What will you do with a result of 60% vs. 40%? If both outcomes would lead to the same decision, the survey isn’t doing useful work.
Once you can answer those three questions clearly, structure follows naturally. Most business surveys need 8–12 questions. Academic research often needs more, with careful sequencing to avoid order bias. Both SurveyNinja and Qualtrics offer templates organized by research type — customer satisfaction, employee engagement, product feedback, NPS, academic research — that give you a proven question sequence to adapt rather than build from scratch.
The most common mistake at this stage is asking too many questions. Every question you add decreases completion rate. Keep only the questions whose answers will change what you do.
SurveyNinja: Fast, Practical, and Genuinely Free
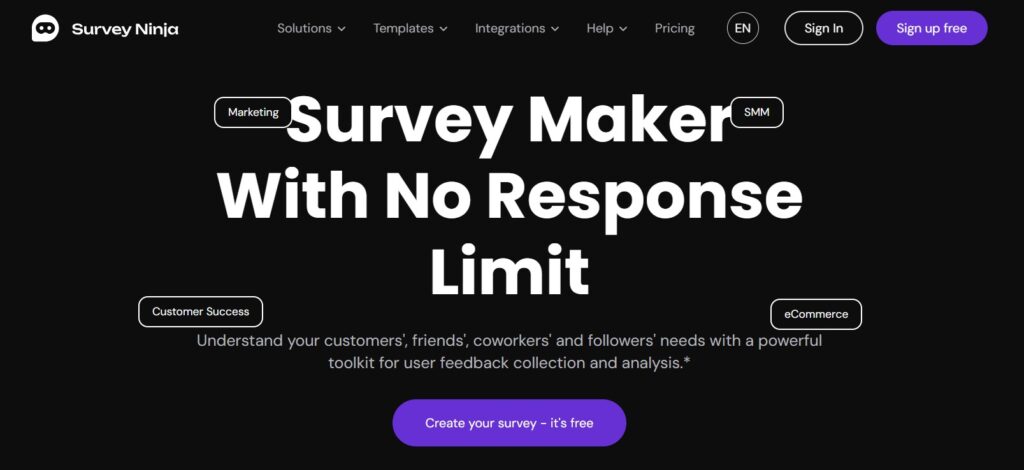
SurveyNinja is built for people who need to run real surveys without a research background or a platform budget. The design priority is clarity over complexity — you can go from a blank survey to a shareable link in under 20 minutes, and the results dashboard is readable without a data analyst explaining it to you.
What the builder actually covers
Question types include NPS (0–10 scale with automatic score calculation), rating scales, multiple choice, single select, matrix questions, open text, yes/no, and dropdown. Each type is pre-formatted — you’re not configuring a generic block, you’re choosing the right instrument for what you’re measuring.
Conditional branching works at the question level: “if the respondent answers X, show question Y next; otherwise skip to Z.” For surveys with multiple audience segments — customers on different plans, users at different stages, respondents from different regions — branching keeps each path relevant without building separate surveys. A customer who rates satisfaction below 5 sees a follow-up asking what specifically went wrong; one who rates it 9 or above gets asked what they’d recommend to a colleague.
Analytics without extra tools
Results appear in a live dashboard as responses come in. NPS questions display score distribution and trend. Rating questions show averages over time. Open-text responses are automatically clustered by recurring keywords — instead of reading 150 individual comments, you see that “onboarding,” “pricing,” and “support speed” each appeared as distinct themes. That clustering is built in, not an add-on.
Sharing results is a single action: SurveyNinja generates a live link that stakeholders can open without logging in. For recurring surveys — monthly NPS, quarterly satisfaction — that link stays current automatically.
In industry discussions like SuperbWebsiteBuilders’ roundup, experts point out that tools like SurveyNinja are redefining accessibility in research – offering professional-grade analytics for small teams, educators, and independent creators alike.
Distribution and integrations
Surveys share via direct link, QR code, embedded widget, or pop-up overlay. Responses export as CSV, or connect through integrations to Google Sheets, Mailchimp, Telegram, and Zapier for CRM routing. Email automation can trigger based on specific answers — a respondent who scores NPS 6 or below automatically enters a recovery sequence without manual intervention.
Pricing: free trial available with full features. Paid plans scale by response volume.
Best for: businesses running ongoing feedback loops — post-onboarding surveys, NPS tracking, product feedback, client satisfaction — where results need to be readable immediately and shareable without a reporting layer on top.
Qualtrics: Enterprise Research Infrastructure
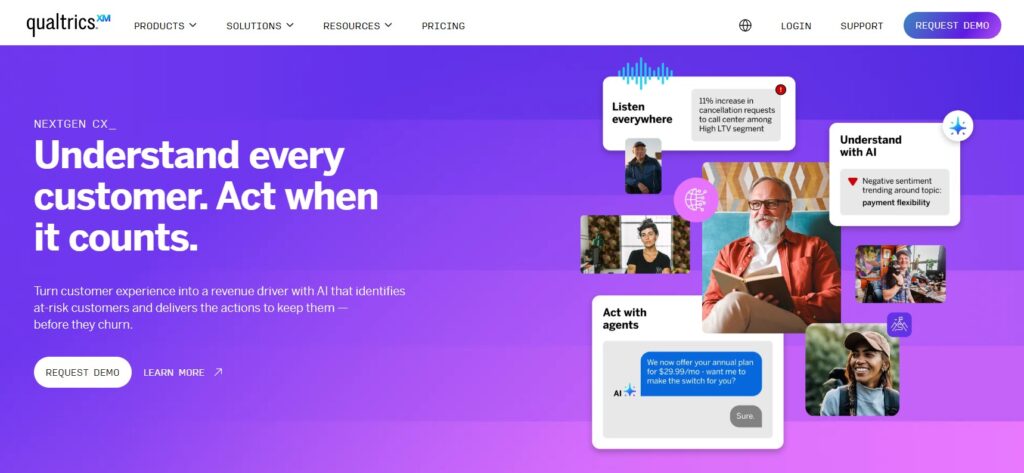
Qualtrics is the tool universities, enterprise HR teams, and professional market researchers use when data quality and methodological rigor are non-negotiable. Over 13,000 organizations use it globally, including the majority of Fortune 500 companies and most major research universities. It’s the platform people refer to as the “gold standard” in professional research communities — the tool you graduate to when SurveyMonkey or a simpler platform starts showing its limitations.
What Qualtrics actually does differently
The question library covers 100+ validated question types including conjoint analysis, MaxDiff, card sorting, heat maps, and advanced matrix formats used in academic psychology, market research, and organizational behavior studies. These aren’t aesthetic variations — they’re different measurement instruments with specific statistical properties.
Display logic, skip logic, and branch logic operate at multiple levels simultaneously: question, block, and survey level. A complex study with different questionnaire paths for different demographic segments, randomized question ordering within each path, and piped-in text that references a respondent’s earlier answers — that’s a standard Qualtrics build, not an advanced one.
The analytics layer supports cross-tabulation (breaking down any question’s results by any demographic variable), statistical significance testing, and data export to SPSS or R for further analysis. Sentiment analysis is available on higher plans for open-text coding at scale.
The free tier reality
Qualtrics offers a free account (no credit card required) with a limited number of responses per survey and basic analytics access. It’s enough to understand the platform’s architecture and run small exploratory studies — not enough for production research at scale. The free tier is best understood as an extended trial that gives you real experience with enterprise methodology before committing to a paid plan.
Best for: academic research, formal customer experience programs, employee engagement studies, and any research context where methodology documentation, data provenance, and statistical rigor matter as much as the results themselves.
Designing a Survey That Works
The questions below are responsible for most survey failures. Fixing them costs nothing and significantly improves data quality.
Leading questions push respondents toward a specific answer. “How satisfied were you with our excellent support team?” is not a satisfaction question — it’s a confirmation request. “How would you rate your experience with our support team?” is the neutral version.
Double-barreled questions ask two things at once. “Was the product easy to use and good value?” forces a single answer to two separate evaluations. Split them.
Undefined scales produce unmeasurable data. A 1–5 rating scale where 1 and 5 aren’t labeled means different things to different respondents. Always anchor both ends: “1 = Very dissatisfied, 5 = Very satisfied.”
Too many open-text questions kill completion rates. One or two open questions — strategically placed at the end, after closed questions have already engaged the respondent — produce far more useful qualitative data than five optional text boxes that most people skip.
Question order effects are real. General questions before specific ones. Attitude questions before behavioral ones. Demographic questions last (people who answer content questions first are more likely to complete the demographics than vice versa).
In SurveyNinja: use the preview mode to test mobile rendering before sharing. The conditional branching editor lets you build the “if X then Y” logic without touching a settings page — it updates the survey flow visually as you configure rules.
In Qualtrics: use the randomization feature to rotate question order across respondents, which averages out order effects in large studies. Block randomization (randomizing groups of questions rather than individual ones) preserves logical flow while reducing bias.
Both platforms let you share a test link with colleagues before going live. Use it. Have someone outside the project complete the survey and tell you where they hesitated or felt confused. That feedback identifies ambiguous questions that you’ve become blind to from working on them too long.
Collecting Data & Analyzing Responses
Getting responses requires making the survey easy to find and credible to complete.
Distribution channels matter. A survey link buried in a monthly newsletter gets a different respondent than one sent as a dedicated email to active users 24 hours after their first purchase. The channel shapes who responds — and selective response is the most common source of misleading survey data. Always think about who your distribution method is likely to miss.
Response rate benchmarks: internal surveys (employees, existing users) typically achieve 20–40% response rates with a personal invitation. External surveys (cold outreach, website visitors) often achieve 5–15%. If your study requires a minimum sample size for statistical validity, plan the distribution size accordingly.
In SurveyNinja: distribute via direct link, QR code, embedded widget on your website, or pop-up overlay. Response data appears in the live dashboard in real time — no waiting for an export. Results filter by date range, question answer, or custom segment if you’ve included segmentation questions. The automatic keyword clustering on open-text responses means you can identify themes in 200 comments in minutes rather than hours.
In Qualtrics: the analytics panel allows cross-tabulation — you can break down any question’s results by any demographic variable. If you asked both “What’s your role?” and “How satisfied are you?”, Qualtrics can show satisfaction scores separately for each role without manual filtering. That segmentation reveals patterns that aggregate data obscures.
The most useful export: both platforms export to CSV. For SurveyNinja, Google Sheets integration means the export is automatic and live — your analysis sheet updates as new responses arrive. For Qualtrics, the SPSS export format is the right choice if you’re running statistical tests (chi-square, regression, ANOVA) on the data.
From Data to Insight
Data collection is the easy part. Interpretation is where most survey projects lose their value.
The most common mistake: reporting averages without context. “Our average satisfaction score was 3.8 out of 5” tells you nothing useful on its own. 3.8 compared to last quarter’s 4.1 tells you satisfaction is declining. 3.8 among enterprise customers vs. 4.3 among small business customers tells you there’s a segmentation problem. 3.8 with 40% of respondents answering 2 or below tells you the average is masking a serious subgroup problem.
What to actually look for:
Distributions, not just averages. A score where 80% of respondents answered 4–5 and 20% answered 1–2 has the same average as one where everyone answered 3 — but they represent completely different situations.
Correlations between questions. Do respondents who answer “Yes” to “Did you complete onboarding?” also score higher on satisfaction? That connection points to a specific action you can take (improve onboarding completion) with a measurable expected outcome (higher satisfaction scores).
Open-text themes alongside closed-question data. SurveyNinja’s keyword clustering tells you which topics appeared most often; Qualtrics’s text analytics codes responses by sentiment and category. In both cases, the open text explains the numbers — it’s the “why” behind the score.
The analysis output that’s actually useful isn’t a slide deck of charts — it’s a list of specific, actionable conclusions: “Satisfaction dropped 0.4 points since last quarter, driven primarily by dissatisfaction with response times among users on the Growth plan. Three of the four lowest-scoring respondents mentioned ‘waited too long’ in their open-text answers.”
That’s a finding. Everything else is data waiting to become one.
Which Tool for Which Job
Use SurveyNinja when the goal is an ongoing feedback loop built into how your business operates — post-purchase surveys, recurring NPS tracking, client satisfaction check-ins, product feedback after a release. The free trial gives you full access to evaluate it against real surveys. The paid plans scale by response volume, not by seat count, which keeps costs predictable as usage grows.
Use Qualtrics when the research methodology itself needs to be defensible — academic studies, formal market research, enterprise employee engagement programs, or any project where the data will be scrutinized by people who understand statistical rigor. Start with the free account to learn the platform before committing to a paid tier.
The decision in one question: after the survey closes, who needs to read the results and what will they do with them? If the answer is “my team, and we’ll act on it next sprint” — SurveyNinja. If the answer is “a research committee, and it’ll inform a formal recommendation” — Qualtrics.
Running surveys well isn’t complicated. It requires a clear question, the right tool, a distribution method that reaches the right people, and the discipline to read the data without confirmation bias. The platforms exist. The methodology is in this guide. The only thing left is to start.